

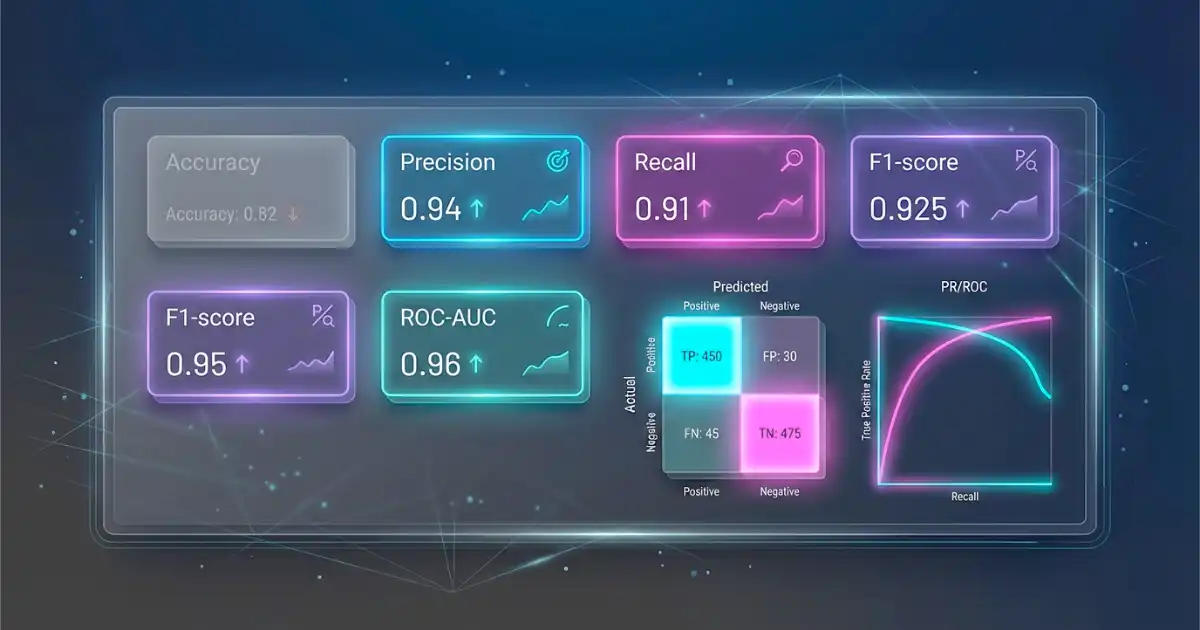
I’ve lost count of how many times I’ve seen a model look “great” in a dashboard, only to fall apart in production. The accuracy says 97 percent, stakeholders are happy, and everyone assumes the model is solid. Then reality hits: fraud slips through, patients are misclassified, or churn spikes unexpectedly. When Does Accuracy Hide Model Errors on Imbalanced Data?
This is one of those classic machine learning traps that you only truly understand after you’ve debugged it in a real system. Accuracy feels safe because it’s simple. But on imbalanced data, it can quietly hide serious model failures that cost money, trust, or even safety.
Let’s break down where accuracy breaks, why it breaks, and how experienced practitioners actually detect the hidden errors.
Why Accuracy Becomes Misleading in Machine Learning
Accuracy is seductive because it answers a simple question: how many predictions were correct?
But machine learning in the real world rarely deals with balanced outcomes. Most business problems are skewed. Fraud is rare. Disease is rare. Churn is relatively rare. And that imbalance changes everything.
Here’s the core issue I’ve seen repeatedly in production systems:
A model can predict the majority class almost all the time and still achieve high accuracy.
That means you can have a model that is technically “right” most of the time but completely useless where it actually matters.
Accuracy assumes all errors are equal. In real systems, they are not. Missing a fraud case is not the same as flagging a legitimate transaction. Missing a disease is not the same as a false alarm.
This mismatch between metric and reality is where things start to go wrong.
What Is Imbalanced Data and Why It Matters
Imbalanced data simply means one class dominates the dataset.
For example:
- 99 percent non-fraud vs 1 percent fraud
- 95 percent healthy vs 5 percent disease
- 90 percent non-churn vs 10 percent churn
At first glance, it seems manageable. But what it really means is that a model can “cheat” by learning the majority pattern and still score high accuracy.
In practice, this leads to models that look strong in training metrics but fail in real decision-making.
I’ve seen teams celebrate a 96 percent accuracy model, only to later realize it was predicting the majority class almost all the time. That missing 4 percent? That was where all the business value lived.
The Accuracy Paradox Explained With Real Examples
The accuracy paradox is simple: high accuracy does not guarantee a good model.
Let’s walk through three real-world cases where this shows up clearly.
Fraud Detection
In fraud systems, fraudulent transactions might be 0.5 to 2 percent of all data.
Imagine a naive model that predicts “not fraud” for everything.
-
Accuracy
98 to 99.5 percent
-
Real performance
completely useless
I’ve seen this exact situation early in fraud detection pipelines. On paper, it looks like a strong model. In reality, it catches zero fraud cases.
The hidden issue is that accuracy is dominated by the majority class.
Medical Diagnosis
Now think about disease detection.
Suppose only 2 percent of patients have a serious condition.
A model that always predicts “healthy” will still be 98 percent accurate.
But it misses every single sick patient.
In production healthcare systems, this is not just a bad model. It’s a dangerous one. And accuracy would still make it look acceptable.
Churn Prediction
In churn modeling, most users stay. Only a small fraction leave.
A model that predicts “no churn” for everyone can still achieve high accuracy.
But the business question is not “how many users did we predict correctly overall.” It is “how many at-risk users did we actually catch.”
Accuracy completely hides that distinction.
How Accuracy Hides Model Errors in Practice
When I debug models in real systems, accuracy hides errors in a few consistent ways.
Majority Class Dominance
The model learns that predicting the majority class is the safest bet.
Even a slightly smarter model can still lean heavily toward majority predictions and inflate accuracy.
This is especially common when the dataset is highly skewed and the loss function is not adjusted.
False Negatives Being Ignored
False negatives are the silent failure mode in imbalanced data.
In fraud detection, a false negative means fraud went through.
In healthcare, it means a missed diagnosis.
Accuracy does not care about this imbalance in error types. It treats all mistakes equally, which is misleading.
Misleading Baselines
One of the biggest traps is not setting a proper baseline.
If your baseline is “always predict majority class,” you might already have 95 percent accuracy before building any model.
So when your model reaches 96 percent, it feels like progress. But in reality, you only improved marginally in a meaningless direction.
Confusion Matrix
If there is one tool I rely on to debug imbalanced models, it is the confusion matrix.
It breaks predictions into:
- True Positives
- True Negatives
- False Positives
- False Negatives
Unlike accuracy, it forces you to see where the model is failing.
In imbalanced problems, the confusion matrix often reveals something uncomfortable: most of your “accuracy” is coming from true negatives in the majority class.
That means your model might be ignoring the minority class entirely.
Once you see this breakdown, accuracy stops being useful on its own.
Why Accuracy Alone Fails in Imbalanced Classification
Accuracy fails because it assumes symmetry where none exists.
In imbalanced data:
- The majority class dominates the score
- Rare events are underweighted
- Business cost of errors is ignored
In production systems, this leads to a gap between offline metrics and real-world performance.
I’ve seen models with 95 percent accuracy fail harder than models with 80 percent accuracy simply because the lower accuracy model was actually catching the minority cases.
That is the part that surprises people coming from academic settings.
Better Metrics That Reveal True Model Performance
Once you move beyond accuracy, you start looking at metrics that reflect real-world costs.
Precision
Precision tells you how many predicted positives were actually correct.
In fraud detection, it answers: “When we flag something, how often are we right?”
High precision reduces false alarms.
Recall
Recall tells you how many actual positives were captured.
In medical diagnosis, it answers: “How many sick patients did we actually detect?”
High recall reduces missed cases.
F1-Score
F1 balances precision and recall.
It becomes useful when both false positives and false negatives matter.
But in production, I always remind teams: F1 is still an abstraction. It hides business-specific costs.
ROC-AUC
ROC-AUC measures how well the model separates classes across thresholds.
It is useful, but I’ve seen it give overly optimistic signals in highly imbalanced datasets.
PR-AUC
PR-AUC is often more honest in imbalanced scenarios.
It focuses on the performance of the minority class, which is usually the real target.
In my experience, PR-AUC is much closer to how models behave in production than ROC-AUC.
How Decision Thresholds Impact Accuracy in Imbalanced Data
Most people forget that classification is not just about the model. It is also about the threshold.
A default threshold of 0.5 can be completely wrong for imbalanced datasets.
You can increase accuracy by shifting the threshold toward the majority class, but you often worsen recall for the minority class.
I’ve seen fraud models where lowering the threshold slightly improved fraud detection dramatically, even if accuracy dropped.
This is where production thinking matters more than leaderboard metrics.
Techniques to Fix Hidden Errors in Imbalanced Models
Once you realize accuracy is hiding problems, the next step is fixing the imbalance itself.
SMOTE and Oversampling
SMOTE creates synthetic minority samples.
It helps the model see more examples of rare cases, but it can also introduce noise if used blindly.
Undersampling
This reduces the majority class size.
It works, but you risk losing useful patterns from the majority class.
Class Weights
One of the most practical approaches.
You penalize mistakes on the minority class more heavily during training.
This is often my first go-to solution in production because it is simple and effective.
Anomaly Detection
When the minority class is extremely rare, reframing the problem as anomaly detection can work better than classification.
This is common in fraud and cybersecurity systems.
Real-World Industries Where Accuracy Fails
Accuracy becomes misleading in many industries:
-
Finance
fraud detection and credit risk
-
Healthcare
disease prediction and diagnostics
-
Telecom
churn prediction
-
Cybersecurity
intrusion detection
-
E-commerce
recommendation edge cases
In all these systems, the cost of missing rare events is much higher than overall accuracy suggests.
How to Properly Evaluate Models on Imbalanced Data
In real projects, evaluation looks different from textbook workflows.
You typically:
- Start with confusion matrix
- Compare against a naive baseline
- Focus on recall for minority class
- Use PR-AUC instead of only ROC-AUC
- Tune thresholds based on business cost
- Validate on real-world distribution, not just training splits
One mistake I see often is evaluating only on balanced validation sets. That completely hides the real problem.
Common Mistakes Data Scientists Make
Here are patterns I’ve seen repeatedly:
- Relying only on accuracy
- Ignoring class distribution in evaluation
- Using default thresholds without adjustment
- Choosing ROC-AUC blindly
- Not defining cost of errors with stakeholders
- Evaluating on artificially balanced datasets
Most of these mistakes come from treating metrics as abstract numbers instead of business signals.
You Might Be Interested In
- What Technologies Power Masdar City Transport And Mobility Systems?
- How To Deploy Machine Learning Models?
- How Does Ai Decision Automation Support Operations?
- How Does Application Performance Testing Help Users?
- What Industries Will Benefit Most From The Uae Stargate Project?
Conclusion
Accuracy becomes misleading the moment your dataset is imbalanced enough that the majority class can dominate predictions. At that point, accuracy stops measuring model quality and starts measuring dataset distribution instead. You can have a model that looks excellent on paper while completely failing to detect the cases that actually matter. The confusion matrix, recall, precision, and PR-AUC are what reveal the truth hiding behind that number.
In practice, accuracy should never be the final decision metric for imbalanced problems. It is only a starting signal, not a judgment. The real evaluation comes from understanding what kinds of errors the model is making and whether those errors are acceptable in the real system it will run in.
FAQs about When Does Accuracy Hide Model Errors on Imbalanced Data?
Why is accuracy not reliable for imbalanced datasets?
Accuracy becomes unreliable in imbalanced datasets because it is heavily influenced by the majority class. When one class dominates, a model can predict that class most of the time and still achieve a high accuracy score, even if it completely ignores the minority class. In practice, this means the metric is no longer reflecting whether the model is actually solving the problem you care about.
From experience, this is where teams often get misled. A model might show 95 to 99 percent accuracy and still fail at detecting fraud, disease, or churn because those are rare events. Accuracy simply does not distinguish between “useful correct predictions” and “easy correct predictions from class imbalance.”
What is a good metric for imbalanced classification problems?
There is no single “best” metric, but in real-world imbalanced problems, precision, recall, and PR-AUC are usually far more meaningful than accuracy. Recall becomes especially important when missing a positive case is expensive, such as fraud detection or medical diagnosis. Precision matters when false alarms create operational or financial costs.
In practice, I usually rely on a combination rather than a single number. PR-AUC is often a strong overall indicator because it focuses on performance across thresholds for the minority class. But the final choice always depends on business cost, not just statistical preference.
How does imbalance affect machine learning models?
Imbalance affects models by biasing them toward the majority class during training. Since the model sees far more examples of the majority class, it naturally learns that predicting it is “safer” and often minimizes loss by favoring it. This leads to weak performance on the minority class, which is usually the most important part of the problem.
In real systems, this shows up as models that look stable but fail silently. They predict the majority class confidently while missing rare but critical events. This is why imbalance is not just a data issue, it directly shapes how the model learns and behaves in production.
Can high accuracy still mean a bad model?
Yes, and this is more common than people expect. A model can achieve high accuracy simply by predicting the majority class most of the time. If the dataset is heavily imbalanced, this strategy can look impressive on paper while completely failing the actual business objective.
I’ve seen this happen in fraud detection systems where accuracy looked above 98 percent, but the model was catching almost no fraud cases. The problem is that accuracy does not care about which class is being predicted correctly, only how often predictions match labels overall.
How do you fix accuracy issues in imbalanced datasets?
Fixing this starts with accepting that accuracy is not the right objective. Once you shift focus to recall, precision, or PR-AUC, you can start applying techniques that improve minority class detection. Common approaches include class weighting, oversampling techniques like SMOTE, undersampling the majority class, and threshold tuning.
In production, I’ve found class weighting and threshold tuning to be the most practical starting points because they do not distort the dataset too aggressively. More advanced methods like anomaly detection or hybrid sampling can also help when the imbalance is extreme. The key is not just improving metrics, but making sure the model aligns with the real cost of mistakes in the system.
