

If you’ve ever trained a model and stared at training logs wondering “is this thing actually learning anything?”, you’ve already been halfway into learning curves territory. How Do Learning Curves Reveal a High-Bias Problem?
A learning curve is simply a plot that shows how a model’s performance changes as training progresses or as the amount of training data increases.
In practice, we usually look at two lines:
- Training performance (loss or accuracy on the data the model learned from)
- Validation performance (loss or accuracy on unseen data)
That’s it. No magic. Just two lines that quietly tell you almost everything about what your model is doing internally.
In real-world ML work, I rarely trust a single metric snapshot. A model might show “85 percent accuracy” and still be completely useless in production. Learning curves are where the truth shows up. They show whether your model is actually learning patterns or just memorizing noise or failing to learn anything meaningful at all.
What makes learning curves powerful is not the numbers themselves, but the gap and shape between them over time.
When you know how to read them properly, they become a diagnostic tool. Almost like an X-ray for your model.
High-Bias in ML Models
High bias is one of those problems that sounds simple in theory but is often misunderstood in practice.
At its core, high bias means your model is too simple to capture the underlying pattern in the data.
But in real projects, I’ve seen engineers misinterpret this constantly. They assume “my model is bad” or “I need more data” when the real issue is that the model is fundamentally underpowered for the task.
High bias usually shows up when:
- The model cannot even fit the training data well
- Both training and validation performance are poor
- Adding more data does not help much
A useful mental model is this:
If your model cannot learn the training set properly, it will not magically perform better on unseen data.
This is where learning curves become extremely useful. They help separate “data problems” from “model capacity problems”.
High bias is not about overfitting or noise. It is about a model that is too constrained, too simplistic, or too rigid.
Think of trying to fit a complex curve using a straight line. No matter how much data you give it, it will still fail.
How Learning Curves Reveal a High-Bias Problem
Now we get to the real diagnostic value.
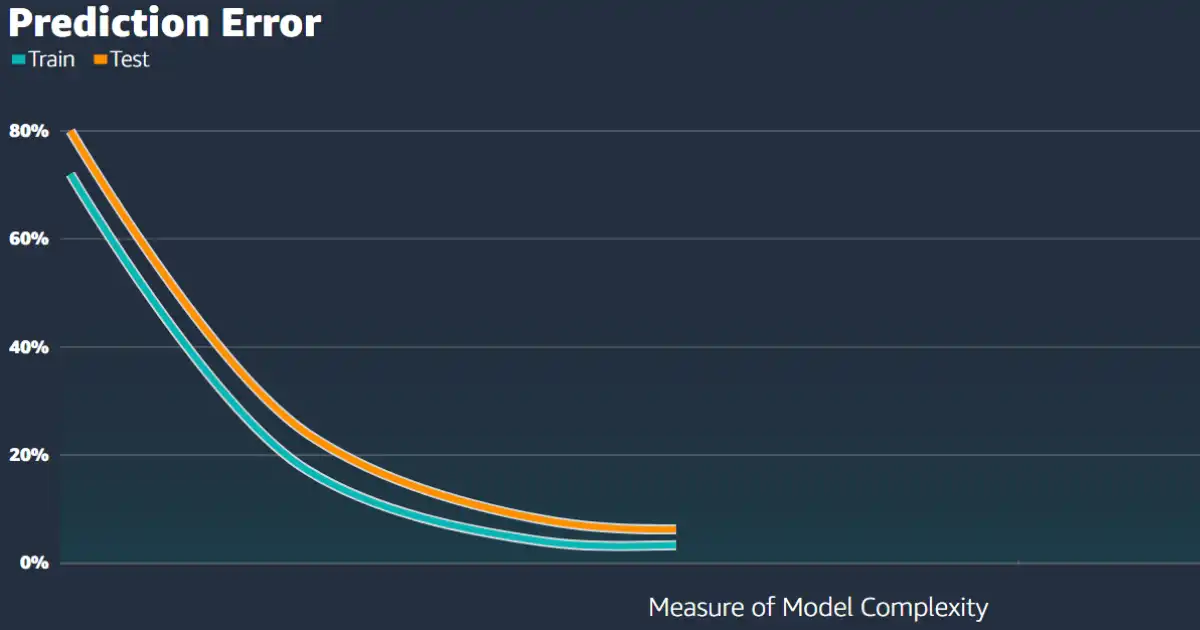
In practice, a high-bias problem shows a very recognizable pattern in learning curves.
Here is what I typically look for when debugging models in real projects:
- Training error is high
- Validation error is also high
- Both curves are close to each other
- Both curves plateau early and do not improve much with more data or training
This pattern is the fingerprint of high bias.
What this tells you is very important:
The model is consistently underperforming everywhere, not just on unseen data.
That distinction matters. Because it means the problem is not generalization. The problem is learning capacity.
A common mistake I see is people assuming “small gap between training and validation is good”. That is only partially true. A small gap with high error on both sides is actually a red flag.
It means the model is equally bad at learning and generalizing.
Another key insight from learning curves is the plateau behavior. In high bias cases, both curves flatten early. Even if you continue training for more epochs or add more data, nothing meaningful changes.
That plateau is your signal that the model has hit a ceiling imposed by its simplicity.
In real production debugging, this is often the moment where you stop tuning hyperparameters blindly and start questioning model choice itself.
Visual Interpretation of High-Bias Learning Curves
Let’s translate this into what you would actually see on a graph.
Imagine a plot where:
- X axis is training iterations or data size
- Y axis is error
Now picture two lines:
Training curve
Starts high, drops slightly, then flattens early
Validation curve
Almost identical behavior to training curve
Starts high, drops slightly, and flattens at nearly the same point
The key visual signals are:
- Both curves are close together
- Both curves are relatively high on the error scale
- Both curves flatten quickly
- No meaningful gap between them
This is very different from overfitting, where training error keeps dropping but validation error stays high or increases.
In high bias, both lines “agree” with each other that the model is bad.
One way I like to explain it to engineers is this:
If both training and validation curves are equally bad, the model is not confused. It is just too limited.
Another subtle visual clue is the early saturation point. If your curves flatten very early in training, it often indicates the model is not expressive enough to keep learning.
Common Causes of High Bias in Models
In real-world systems, high bias rarely comes from a single obvious mistake. It usually comes from a combination of design choices that unintentionally restrict learning.
Here are the most common causes I’ve seen in production debugging:
Model too simple
Using linear models or shallow trees for complex nonlinear problems is a classic mistake.
I’ve seen teams try to solve fraud detection or NLP classification with overly simple models because they are easier to deploy. The result is always high bias.
Too much regularization
Regularization is useful, but too much of it can cripple the model.
L1 or L2 penalties that are too strong force weights toward zero, effectively reducing model capacity.
Dropout can also contribute if applied aggressively.
Insufficient feature representation
Sometimes the model is fine, but the input features are weak.
If you feed a powerful model poor features, it behaves like a simple model.
This is extremely common in real systems where feature engineering is rushed.
Undertrained model
If training is stopped too early, the model may never reach its learning potential.
This is often mistaken for high bias when it is actually a training configuration issue.
Wrong architecture choice
Using a model that is not suited for the data structure is a subtle but common issue.
For example, using a simple feedforward network for sequence-heavy problems without proper feature design.
How to Fix a High-Bias Problem
Fixing high bias is usually about increasing model capacity or improving representation.
Here is how I approach it in real debugging sessions:
Increase model complexity
This is the most direct fix.
- Add more layers in neural networks
- Use deeper trees in tree-based models
- Switch from linear models to nonlinear models
But I always caution teams not to jump blindly into complexity. You need confirmation from learning curves first.
Reduce regularization
If regularization is too strong, loosen it.
- Lower L1 or L2 penalties
- Reduce dropout rates
- Relax early stopping constraints
In practice, I often find teams over-regularize out of fear of overfitting.
Improve feature engineering
This is often the highest ROI fix.
Better features can completely change the learning dynamics.
In some production cases I’ve worked on, simply adding interaction features or domain-specific aggregations solved what looked like a model problem.
Train longer
Sometimes the model just needs more time.
If both curves are still improving slowly, more epochs can help.
But if curves are fully flat, training longer will not fix anything.
Switch model family
When nothing else works, the model itself might be the limitation.
For example:
- Linear regression to gradient boosting
- Shallow trees to boosted ensembles
- Basic neural nets to deeper architectures
Real-World Example of High Bias Detection
Let’s take a practical scenario.
Imagine you are building a fraud detection system for transactions.
You start with a logistic regression model because it is fast and interpretable.
After training, you see:
-
Training accuracy
78 percent
-
Validation accuracy
77 percent
You think this looks stable, so you deploy it.
But then production performance is disappointing. Fraud cases are still slipping through.
Now you plot learning curves.
What you see:
- Training loss starts high and barely improves
- Validation loss mirrors training loss almost exactly
- Both curves flatten early
This is a textbook high-bias pattern.
The model is not overfitting. It is simply not expressive enough to capture fraud patterns, which are often nonlinear and feature-interaction heavy.
When you switch to a gradient boosting model and add transaction velocity features, both training and validation performance jump significantly.
That is the key insight:
Learning curves didn’t just tell you the model was bad. They told you why it was bad.
High Bias vs High Variance Learning Curves
This is where most confusion happens in practice.
High bias
- Training error: high
- Validation error: high
- Gap: small
- Curves: close together, flat
High variance
- Training error: low
- Validation error: high
- Gap: large
- Curves: diverging
A useful mental shortcut:
- High bias means the model cannot learn
- High variance means the model learns too specifically
In debugging sessions, I always check which side the gap is pointing to before changing anything.
Because the fix is completely different.
Limitations of Learning Curves
Learning curves are powerful, but they are not perfect.
Here are a few real-world limitations:
They depend on correct data splits
If your validation set is not representative, the curves can mislead you.
No insight into feature quality
They tell you something is wrong, but not always what feature is responsible.
Can hide subtle overfitting
In noisy datasets, curves can look stable even when the model is overfitting small patterns.
Computational cost
Generating learning curves properly can be expensive for large datasets.
Ambiguous middle cases
Sometimes curves do not clearly show high bias or high variance. You get mixed signals.
In practice, I always combine learning curves with error analysis and feature inspection.
You Might Be Interested In
- How Can Ai Reduce False Positives In Security Monitoring?
- How Does Cloud Workload Management Improve Scalability?
- How Can Ai Improve Smart Waste Management In Cities?
- How Does Agentic AI Change the Attack Surface?
- What Is Managed Cloud Hosting?
Conclusion
Learning curves reveal high bias by showing a very specific failure pattern where both training and validation performance remain poor and closely aligned. This tells you the model is not struggling with generalization, but with fundamental learning capacity. In real debugging work, this is one of the clearest signals that the model is too simple, too constrained, or not properly supported by the right features.
In practical machine learning systems, the real value of learning curves is not just diagnosis but direction. They guide you toward the correct fix, whether that is increasing model complexity, improving features, or reducing overly aggressive regularization. When you learn to read these curves properly, you stop guessing and start understanding what your model is actually doing under the hood.
FAQs
What is the main sign of high bias in learning curves?
The most reliable sign of high bias is when both training and validation errors stay high and remain very close to each other throughout training. In real debugging scenarios, this usually shows up as two curves moving almost in sync, improving a little at the beginning and then flattening early without any meaningful gap between them.
What this really tells you is that the model is not overfitting or struggling with generalization. It is simply not powerful enough to learn the underlying patterns in the data. Even if you keep training longer or adjust minor hyperparameters, the behavior of both curves usually stays the same because the limitation is structural, not procedural.
Can more data fix high bias?
In most real-world cases, adding more data does not fix high bias. If your model is fundamentally too simple or too constrained, giving it more examples will not change its inability to capture the underlying relationships in the data. You might see very small improvements, but the overall plateau remains.
The key intuition here is that high bias is a capacity problem, not a data problem. Learning curves often make this obvious because both training and validation curves flatten early. When that happens, more data does not shift the ceiling of performance because the model itself cannot represent a more complex function.
Is high bias always a model problem?
Not always, and this is where real-world debugging gets interesting. High bias often comes from an underpowered model, but it can also be caused by weak features or overly aggressive regularization that effectively shrinks the model’s learning ability. In practice, I’ve seen cases where the model was fine, but the input representation was so poor that it behaved like a simple model.
This is why learning curves alone are not enough. They tell you something is wrong, but not always exactly where the issue lies. You still need to check feature quality, preprocessing steps, and training configuration before concluding that the model itself is the bottleneck.
How do I know if I should change the model?
If your learning curves show both training and validation errors stuck at a high level with little or no improvement over time, that is a strong signal that increasing model capacity is necessary. In practice, this usually means your current model has reached its expressive limit and cannot capture the complexity of the task.
However, before switching models, it is always worth checking simpler fixes like feature improvements or reducing regularization. If those do not change the curve behavior, then moving to a more powerful model becomes the logical next step rather than an experimental guess.
Can high bias and high variance happen together?
They cannot appear in the same learning curve pattern at the same time, because they represent opposite failure modes. High bias shows up when both training and validation errors are high and close together, while high variance shows up when training error is low but validation error remains high with a large gap between the two.
That said, in real systems you can sometimes see a transition between the two depending on model changes. For example, increasing model complexity might reduce bias but introduce variance. This is why learning curves are useful over time, not just as a one-time snapshot, because they help you track how the model’s failure mode shifts as you tune it.
